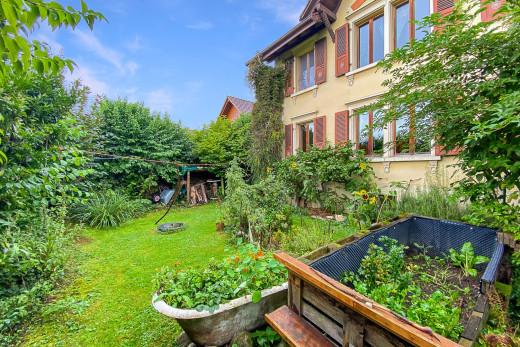
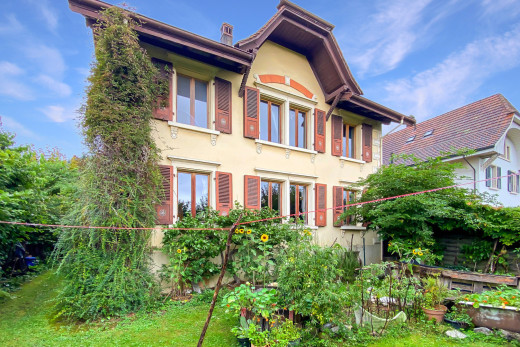
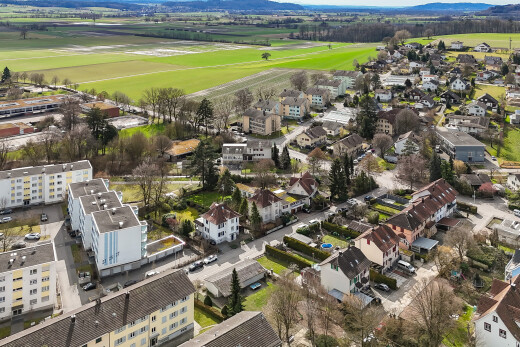
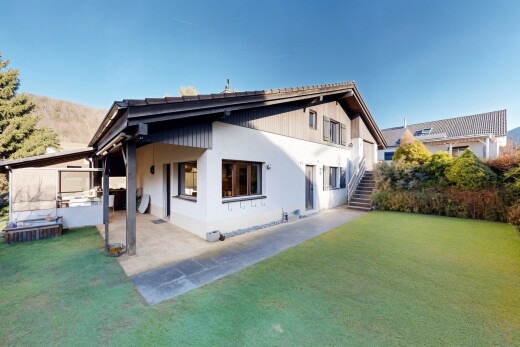
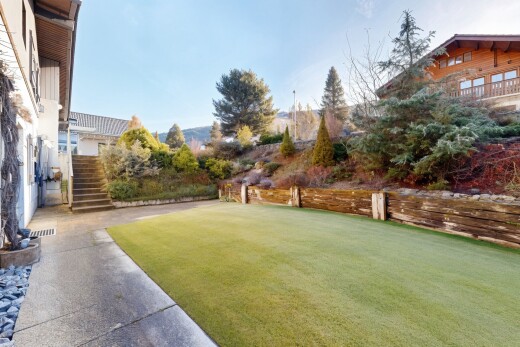
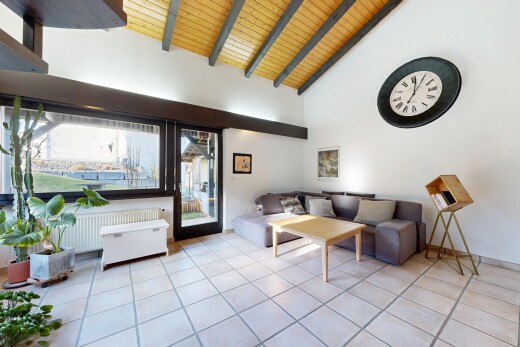
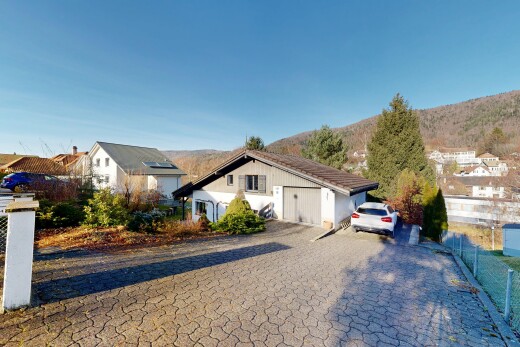
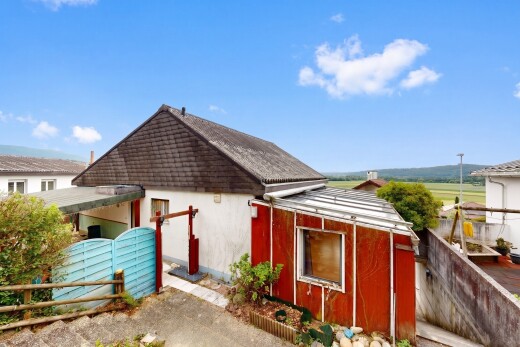
Properties for sale near Romont (BE)
The main real estate agencies in Romont (BE) are Neho in terms of the number of properties for sale.


Average price m² in Romont (BE)
Localities in the municipality of Romont (BE)
")
")
Education, health, crime and culture in the municipality of Romont (BE)


Your real estate agents in Romont (BE)
Benefit from complete support for the sale of your property.

Adnan Alimi
Neho real estate agent in Romont (BE)

Adnan Alimi is a real estate expert active in the regions of Jura, the Bernese Jura, and Neuchâtel. He supports sellers and buyers with attentive listening, transparency, and availability, while adopting a personalized approach to clearly understand the needs and expectations of each client. Thanks to his strong service mindset and experience in customer relations, he ensures clear and reassuring guidance throughout the entire real estate process. His knowledge of the regional market and his professional rigor help ensure smooth and secure transactions. Committed and attentive to detail, Adnan places great importance on building long-term trust with his clients and providing reliable support at every stage of their real estate project. His structured approach and advisory skills enable him to efficiently manage each property sale or acquisition.

Rafael Rosa
Neho real estate agent in Romont (BE)
Rafael Rosa is a real estate expert active in La Chaux-de-Fonds and across the canton of Neuchâtel, particularly in Neuchâtel, Le Locle, and the surrounding areas. He supports sellers and buyers with precision, attentive listening, and professionalism, while adopting a structured approach to clearly understand each client’s expectations. Thanks to his experience in managing complex projects, he provides clear and methodical guidance throughout the entire real estate process. His strong organizational skills and attention to detail help ensure structured and secure transactions in the Neuchâtel real estate market. Committed and attentive, Rafael focuses on building long-term trust with his clients and defending their interests to ensure that every property sale or purchase is carried out under the best possible conditions. His analytical mindset and coordination skills ensure careful support at every stage of a real estate project.
Elisa Krebs
Real estate agent in Romont (BE)
Elisa Krebs is a real estate agent in the Biel/Bienne region. She combines her passion for real estate with a keen sense of her clients’ individual needs. Her bilingual proficiency in German and French—complemented by English and Spanish—provides the ideal foundation for seamless collaboration in the bilingual Solothurn/Biel region. As a real estate agent, Elisa Krebs places great importance on open communication and close cooperation. She supports both sellers and buyers with expertise, reliability, and dedication throughout every phase of their real estate transaction. Her goal is not just to sell properties but to ensure that her clients feel well taken care of and in the best hands. With her by your side, you have an agent who is fully committed to your property and your goals.

Yanisa Zweifel
Sales Coordinator in Romont (BE)
Whether you're buying or selling a single-family home, an apartment, or a plot of land, Yanisa Zweifel provides comprehensive guidance for your property transaction. With six years of experience in client advisory and a friendly, solution-oriented approach, she ensures you receive expert support every step of the way. Property buyers and sellers particularly appreciate Yanisa Zweifel’s friendly nature and her dedication to finding the best possible solution for her clients. Working closely alongside our real estate agents, she ensures that both buyers and sellers receive optimal support throughout their property transactions.

Lucas Martin
Sales Coordinator in Romont (BE)
Lucas Martin works at Neho as a Sales Coordinator. With four years of experience in commerce and sales, particularly in the automotive sector and continuing education, Lucas leverages his expertise to assist clients throughout the real estate process. Holding a Master's in Commerce Management (RNCP level 7), he ensures he understands each client's specific needs and provides tailored solutions. Passionate about varied and stimulating tasks, Lucas is committed to delivering high-quality service that meets his clients' expectations. He speaks French and English.
Our nearby latest properties sold
Exact address available after login
Exact address available after login
Exact address available after login
Exact address available after login
Exact address available after login
Exact address available after login
Romont (BE): Quality of life and real estate market
Contact your local team
We are available to answer all your questions, advise you and support you in your sale.